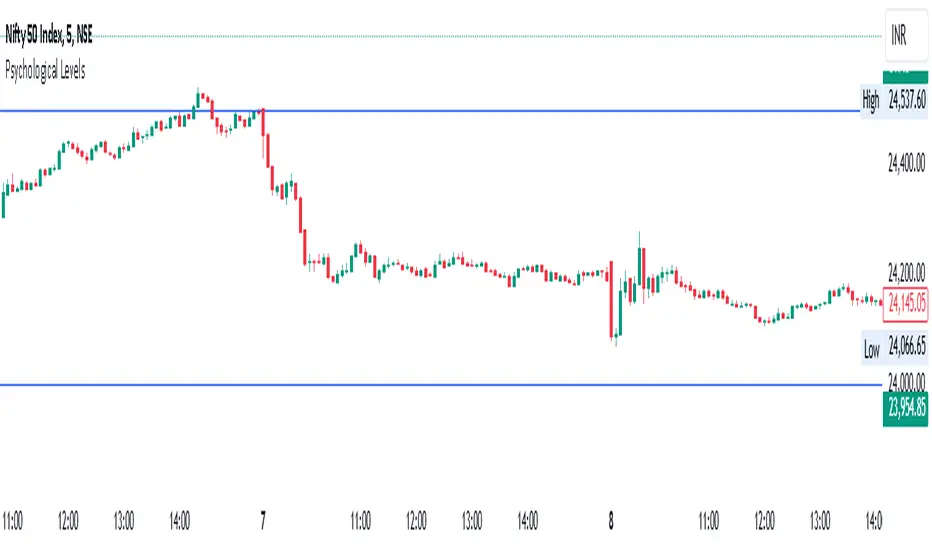
Volume Orderblock Breakout — Naaganeunja Lite v3.6Volume orderblocks breakout indicator
you can use it 5minutes (short trading)
or 4 hours(swing trading)
it is best indicator in the world
Cerca negli script per "swing trading"
**MACD + RSI + MFI by IspatialResources – Multi-Tool Indicator**
This indicator is a **multi-functional technical analysis tool** that combines the following professional oscillators into a single panel:
* ✅ **Customizable MACD**
* ✅ **Advanced RSI with Moving Average and Bollinger Bands**
* ✅ **Money Flow Index (MFI)**
* ✅ **Module-based enable/disable system**
* ✅ **Fully configurable alerts**
It is designed to help identify **overbought and oversold conditions, trend strength, and momentum shifts**, improving market reading across multiple assets.
---
### 🔹 INCLUDED MODULES
**1️⃣ MACD**
* Fast and slow moving average settings
* Selectable MA type (SMA / EMA)
* Dynamic histogram
* Momentum change alerts
**2️⃣ Advanced RSI**
* Classic RSI with dynamic levels
* Moving average applied to RSI
* Optional **Bollinger Bands on RSI**
* Visual overbought and oversold signals
* Extreme condition alerts
**3️⃣ MFI (Money Flow Index)**
* Buying and selling pressure detection
* Overbought and oversold zones
* Ideal for volume and strength analysis
---
### 🔹 SUPPORTED MARKETS
This indicator can be used on:
* 📈 Cryptocurrencies
* 📊 Stock Indices
* 💱 Forex
* 📉 Stocks
It works on **all timeframes**: intraday, swing trading, and long-term analysis.
---
### 🔹 HOW TO USE IT
* Enable or disable each module from the settings panel.
* Use the **RSI with bands** to detect extreme zones.
* Confirm potential entries with the **MACD**.
* Filter false signals with the **MFI**.
* Combine it with market structure, support, and resistance.
---
### ⚠️ RISK DISCLAIMER
This indicator is **for educational and technical analysis purposes only**.
**It does not constitute financial advice and does not guarantee results.**
Trading involves risk, and each user is responsible for their own decisions.
---
### 👤 AUTHOR
Created by **Ismael** as a personal tool for market analysis and study.
---
🚀 If you find this indicator useful, feel free to support it with a “like” for future updates.
EMA750 & VWAP Cross IndicatorA trend-following indicator that identifies high-probability entry signals based on EMA750 and VWAP crossovers.
How it works:
Monitors price position relative to EMA750 (trend filter)
Generates LONG signals when price crosses above VWAP while above EMA750
Generates SHORT signals when price crosses below VWAP while below EMA750
Highlights the FIRST signal after each EMA cross (yellow markers)
Automatically calculates targets based on recent swing highs/lows
Stop loss set at EMA750 level
Features:
✓ Visual target and stop loss levels
✓ Customizable alerts for first and all signals
✓ Real-time status dashboard
✓ Swing point detection for target calculation
✓ Signal tracking until opposite VWAP cross
Best for: Swing trading and trend-following strategies on higher timeframes.
HTF Frequency Zone [BigBeluga]🔵 OVERVIEW
HTF Frequency Zone highlights the dominant price level (Point of Control) and the full high–low expansion of any higher timeframe — Daily, Weekly, or Monthly. It captures the frequency of closes inside each HTF candle and plots the most traded “frequency zone”, allowing traders to easily see where price spent the most time and where buy/sell pressure accumulated.
This tool transforms each higher-timeframe bar into a fully visualized structure:
• Top = HTF high
• Bottom = HTF low
• Midline = HTF Frequency POC
• Color-coded zones = bullish or bearish bias
• Labels = counts of bullish and bearish candles inside the HTF range
It is designed to give traders an immediate understanding of high-timeframe balance, imbalance, and price attraction zones.
🔵 CONCEPTS
HTF Partitioning — Each Weekly/Daily/Monthly candle is converted into a dedicated zone with its own High, Low, and Frequency Point of Control.
Frequency POC (Most Touched Price) — The indicator divides the HTF range into 100 bins and counts how many times price closed near each level.
Dominant Zone — The level with the highest frequency becomes the HTF “Value Zone,” plotted as a bold central line.
Directional Bias —
• Bullish HTF zone
• Bearish HTF zone
Internal Candle Counting — Within each HTF period the indicator counts:
• Buy candles (close > open)
• Sell candles (close < open)
This reveals whether intraperiod flow was bullish or bearish.
HTF Structure Blocks — High, Low, and POC are connected across the entire higher-timeframe duration, showing the real shape of HTF balance.
🔵 FEATURES
Automatic HTF Zone Construction — Generates a complete price zone every time the selected timeframe flips (Daily / Weekly / Monthly).
Dynamic High & Low Extraction — The indicator scans every bar inside the HTF window to find true extremes of the range.
100-Level Frequency Scan — Each close within the period is assigned to a bin, creating a detailed distribution of price interaction.
HTF POC Highlighting — The most frequent price level is plotted with a bold red line for immediate visual clarity.
Bull/Bear Coloring —
• Green → Bullish HTF zone.
• Orange → Bearish HTF zone.
Zone Shading — High–Low range is filled with a semi-transparent color matching trend direction.
Buy/Sell Candle Counters — Printed at the top and bottom of each HTF block, showing how many internal candles were bullish or bearish.
POC Label — Displays frequency count (how many touches) at the POC level.
Adaptive Threshold Warning — If bars inside the HTF window are too few (<10), the indicator warns the trader to switch timeframe.
🔵 HOW TO USE
Higher-Timeframe Biasing — Read the zone color to determine if the HTF candle leaned bullish or bearish.
Value Zone Reactions — Price often reacts to the Frequency POC; use it as support/resistance or liquidity magnet.
Range Context — Identify when price is trading near HTF highs (breakout potential) or lows (reversal potential).
Momentum Evaluation — More bullish internal candles = internal buying pressure; more bearish = internal selling pressure.
Swing Trading — Use HTF zones as the “macro map,” then execute trades on lower timeframes aligned with the zone structure.
Liquidity Awareness — The HTF POC often aligns with algorithmic liquidity levels, making it a strong reaction point.
🔵 CONCLUSION
HTF Frequency Zone transforms raw higher-timeframe candles into detailed distribution zones that reveal true market behavior inside the HTF structure. By showing highs, lows, buying/selling activity, and the most interacted price level (Frequency POC), this tool becomes invaluable for traders who want to align executions with powerful HTF levels, liquidity magnets, and structural zones.
Pro Stage (Weekly 30W) + Pro Trade Rating + RS/Volume + DebugA professional, multi-factor trend assessment tool built for swing traders and position traders who rely on Weinstein Stage Analysis, IBD-style relative strength, and institutional volume signals. Designed to give you a complete regime read + daily execution rating in one compact table.
Provides a multi-timeframe trend assessment for improved swing-trading decisions.
Identifies higher-timeframe trend conditions and presents a simplified classification.
Displays current trend state, prior trend state, and time in state.
Includes a proprietary Trade Quality Score designed for internal decision-making.
Score incorporates a combination of factors across multiple timeframes.
All calculations use a custom weighting model tailored for advanced users.
This indicator is not intended for reverse engineering or redistribution.
Multi-Timeframe Fair Value Gap by Vigna📊 Multi-Timeframe Fair Value Gap (FVG) Indicator
This indicator displays Fair Value Gaps (FVGs) from multiple timeframes simultaneously on your chart. FVGs are price gaps that occur when the market moves quickly and skips certain price levels. These gaps tend to be "filled" later and often serve as important support and resistance zones.
🎯 What are Fair Value Gaps?
A Fair Value Gap occurs when:
Bullish FVG: The current low is higher than the high from 2 candles ago (gap upward)
Bearish FVG: The current high is lower than the low from 2 candles ago (gap downward)
⏱️ Supported Timeframes:
1 Hour (1H)
2 Hours (2H)
3 Hours (3H)
4 Hours (4H)
1 Day (1D)
1 Week (1W)
🎨 Features:
✅ All timeframes visible simultaneously
✅ Each timeframe has its own color (bullish & bearish)
✅ Labels show the timeframe of each gap
✅ Automatic deletion when gap is filled
✅ Optional: MidPoint Fill (gap marked as filled at 50%)
✅ Extend right: Gaps extend to the right until filled
✅ All colors fully customizable
⚙️ Settings:
Timeframes: Enable/disable individual timeframes as needed
MidPoint Fill: Mark gap as filled when 50% is reached
Delete On Fill: Automatically remove filled gaps from chart
Label Timeframes: Show labels with timeframe names
Colors: Customize all colors to your preferences
💡 Application:
FVGs often serve as magnetic attraction points for price
Higher timeframe FVGs (4H, 1D, 1W) are typically more significant
Use FVGs as potential entry/exit zones
Combine with other indicators for better confirmation
📈 Recommended Use:
Works best on timeframes from 15min to 1H
Ideal for Forex, Crypto, and Stocks
Especially useful for Swing Trading and Day Trading
🔧 Technical Details:
Uses optimized request.security() calls (12 total, under the 40 limit)
Employs tuple syntax for efficient data fetching
Real-time gap detection and filling mechanism
Memory-efficient array management with var keyword
Quicksilver Recovery Overlay [Strict]The Quicksilver Recovery Overlay is a proprietary visual analysis tool designed to identify high-probability reversal points in volatile markets. Originally developed for internal use to stabilize Prop Firm drawdowns, this script translates complex algorithmic logic into simple, actionable visual signals on your chart.
🚫 The Problem:
Most traders lose capital trying to "catch a falling knife." They buy too early during a crash and get liquidated before the reversal happens.
✅ The Solution:
This overlay forces discipline. It will only print a "QS BUY" signal when three specific institutional criteria are met simultaneously. If the setup is not perfect, the chart remains clean, keeping you out of bad trades.
The Logic (The "Triple Confluence" Engine):
Deep Exhaustion: The Stochastic RSI must pierce the extreme oversold zone (< 20), indicating seller exhaustion.
Momentum Crossover: The Fast %K line must cross above the Slow %D line, confirming momentum has shifted.
Heikin Ashi Filter: The current Heikin Ashi candle must be GREEN (Bullish). This filters out "fake" reversals where price is still wicking down.
Features:
Visual Signal Labels: Green "QS BUY" and Red "QS SELL" tags appear directly on the bar.
Zero Repaint Logic: Signals are confirmed on candle close.
Status Dashboard: A built-in monitor in the top right corner confirms the algorithm is active.
Recommended Settings:
Assets: ETHUSD, BTCUSD, XAUUSD (Gold).
Timeframes:
1-Minute: For scalping and drawdown recovery.
15-Minute: For swing trading and trend reversals.
How to Get Access:
This is a Protected Script. Access is granted exclusively to members of the Quicksilver Algo Systems ecosystem.
Get your license key here: whop.com
Risk Disclosure: Trading involves substantial risk. Past performance is not indicative of future results.
EMA/SMA Crossover Signals📊 EMA/SMA Crossover Signals
A professional trading indicator that identifies golden and death crosses between a customizable EMA and SMA with clear BUY/SELL labels displayed directly on your chart.
🎯 Key Features:
✅ Customizable Moving Averages - Adjust both EMA and SMA periods to match your trading strategy
✅ Clear Signal Labels - Large, color-coded "BUY" and "SELL" labels that are impossible to miss
✅ Adjustable Label Positioning - Control the vertical distance of signal labels from price action
✅ Professional Color Customization - Change colors for both moving averages and signals to match your theme
✅ Label Size Options - Choose from 4 different sizes (Tiny, Small, Normal, Large)
✅ Audio Alerts - Get notified instantly when crossovers occur
✅ Overlay Display - Signals appear directly on your price chart for better context
📈 How It Works:
🟢 BUY Signal: Triggered when the EMA crosses above the SMA (bullish crossover)
🔴 SELL Signal: Triggered when the EMA crosses below the SMA (bearish crossover)
⚙️ Customizable Settings:
Moving Averages:
- EMA Period (Default: 8)
- SMA Period (Default: 200)
Colors:
- EMA Color
- SMA Color
- Buy Signal Color
- Sell Signal Color
Signal Settings:
- Signal Vertical Offset
- Label Vertical Offset
- Label Size
💡 Best For:
- Day Trading (1-5 min timeframes)
- Swing Trading (4H-Daily)
- Trend Following Strategies
- Identifying momentum shifts
- Confirming market structure changes
🔔 Perfect for traders using ICT, Wyckoff, and institutional trading methodologies
Use this indicator as part of your complete trading system. Always combine with proper risk management and additional confluence factors.
GBM Prob: nearest unswept H/L (up to 50 bars)This indicator is designed to analyze market structure and price behavior in relation to previous highs and lows. It automatically identifies prior swing highs and lows and tracks whether they have been taken by the current price movement.
The main goal of the indicator is to show which side of the market has already been cleared of liquidity and where untouched liquidity remains. Based on this data, it calculates the percentage of liquidity taken, helping traders assess the directional bias of price.
The indicator can be used as a higher timeframe filter (D1, H4) and as contextual guidance for entries on lower timeframes during the London and New York sessions. It works especially well with ICT / SMC concepts, OTE zones, and liquidity-based analysis.
Suitable for both intraday and swing trading, the indicator helps traders make more informed decisions and avoid trading against already swept liquidity.
Buy & Sell Arrows - MACD + Best_Solve WPRMACD + Best_Solve Williams %R – Aggressive Trend-Reversal Catcher
(Allow Signals Even in Overbought/Oversold Zones)
This indicator combines the classic MACD histogram with Best_Solve’s popular custom Williams %R (a 0–100 momentum oscillator that behaves more like a fast Stochastic) to deliver clean, high-conviction entry signals on daily (and higher) timeframes.
Core Logic – Only TWO conditions are required
BUY (large green arrow below bar)
MACD histogram is green (bullish momentum)
Williams %R fast line is crossing above OR already above its EMA
SELL (large red arrow above bar)
MACD histogram is red (bearish momentum)
Williams %R fast line is crossing below OR already below its EMA
Unlike most oscillators, this version deliberately removes the traditional “do not buy when overbought / do not sell when oversold” filters. This allows the script to catch powerful trend reversals and explosive moves immediately — even on violent earnings gaps or panic sell-offs (example: META’s -11 % drop on Oct 30 2025 triggered an instant sell even though %R was deeply oversold).
Built-in Clean-Signal Logic
No consecutive buys or sells — each new signal must be preceded by the opposite direction.
This keeps the chart extremely clean and prevents whipsaw clusters during strong trends.
Best Use Cases
Daily and 4H swing trading on stocks, indices, crypto, forex
Excellent for catching sharp reversals after earnings, news events, or overextended moves
Works especially well on high-beta names and growth stocks
Visuals
Large green/red arrows with “BUY” / “SELL” text (your favorite style)
Subtle transparent MACD histogram overlaid on price for instant momentum context
Ready-to-use alerts (“Buy Alert” / “Sell Alert”)
Set it, alert it, trade it — one of the cleanest and most responsive daily reversal systems you’ll find.
Enjoy the edge!
Bayesian Liquidity Pain & Gain [Instit. Vol Weighted]Bayesian Liquidity Pain & Gain Indicator
Stop guessing where support and resistance are.
The Bayesian Liquidity Pain & Gain indicator moves beyond arbitrary lines and raw price action. It quantifies Institutional Intent by calculating the exact price levels where large volume has been accumulated and visualizes the "Pain" (stress) those participants feel when the market moves against them.
The Logic: Quantified Institutional Stress
Institutions don't trade single candles; they accumulate positions over time. This indicator tracks their Volume-Weighted Average Cost Basis to answer two critical questions:
Where did they enter? (The Cost Basis Lines)
Are they underwater? (The Pain Clouds)
By normalizing price distance using volatility (ATR) and statistical deviation (Z-Score), we filter out noise and only highlight zones where "Smart Money" is statistically forced to defend their positions or capitulate.
How to Read the Chart
1. The Cost Basis Lines (Anchors)
• 🟢 Green Line (Buyer Cost Basis): The average price where institutions accumulated long positions. This acts as dynamic Support.
• 🔴 Red Line (Seller Cost Basis): The average price where institutions accumulated short positions. This acts as dynamic Resistance.
2. The Pain Clouds (Signals)
When price moves significantly away from the cost basis (Z-Score > 2.0), "Clouds" appear to visualize the PnL status of the participants:
• 🔴 Red Cloud (Buyer Pain): Price is below the buyer's entry. Buyers are losing money (in the red). This creates a "Discount" zone where they may defend support.
• 🟢 Green Cloud (Seller Pain): Price is above the seller's entry. Sellers are losing money (shorts are squeezed). This indicates strong bullish momentum.
3. The Multi-Timeframe Dashboard
A real-time HUD showing the Z-Score status across 4 timeframes (1m, 5m, 15m, 1h):
• 🟢 Green: Profitable/Neutral (Trend Continuation)
• 🟠 Orange: Warning (Pressure Building)
• 🔴 Red: Critical Pain (High Probability Reversal)
Trading Strategies
Setup 1: The Defensive Bounce (Long)
• Context: Price drops into a 🔴 Red Cloud (Buyer Pain).
• Trigger: Price touches the 🟢 Green Line (Buyer Cost Basis) and shows a rejection wick.
• Logic: Institutional buyers defend their cost basis to avoid realizing losses.
Setup 2: The Short Squeeze (Momentum)
• Context: Price rallies into a 🟢 Green Cloud (Seller Pain).
• Trigger: Price holds above the 🔴 Red Line (Seller Cost Basis).
• Logic: Short sellers are trapped and forced to buy back (cover), fueling the rally.
Fractal Alignment:
For high-conviction trades, wait for the Dashboard to show "Pain" signals on both the 1h (Anchor) and 5m (Trigger) timeframes simultaneously.
Settings
• Memory Length (Default 144): The lookback period for the institutional cost basis. Increase for swing trading, decrease for scalping.
• Sigma Threshold (Default 2.0): The statistical confidence level for "Pain". Higher values = fewer, stronger signals.
• Volume Amp: When enabled, high volume amplifies the pain signal, giving more weight to institutional footprints.
DarkPool FlowDarkPool Flow is a professional-grade technical analysis tool designed to align retail traders with the dominant "smart money" flow. Unlike standard moving average crossovers that often generate false signals during consolidation, this script employs a multi-layered filtering engine to isolate high-probability trends.
The core philosophy of this indicator is that Trends are fractal. A sustainable move on a lower timeframe must be supported by momentum on a higher timeframe. By comparing a "Fast Signal Trend" against a "Slow Anchor Trend" (e.g., Daily vs. Weekly), the script identifies the market bias used by institutional algorithms.
This edition features a Smart Recovery Engine, ensuring that valid trends are not missed simply because momentum started slowly, and a Dynamic Cloud that visually represents the strength of the trend spread.
Key Features
1. Auto-Adaptive Timeframe Logic
The script eliminates the guesswork of Multi-Timeframe (MTF) selection. By enabling "Auto-Adapt," the indicator detects your current chart timeframe and automatically maps it to the mathematically correct institutional pairings:
Scalping (<15m): Uses 15-Minute Trend vs. 1-Hour Anchor.
Day Trading (15m - 1H): Uses 4-Hour Trend vs. Daily Anchor.
Swing Trading (4H - Daily): Uses Daily Trend vs. Weekly Anchor (The classic "Golden" setup).
Investing (Weekly): Uses 21-Week EMA vs. 50-Week SMA (Bull Market Support Band logic).
2. Smart Recovery Signal Engine
Standard crossover scripts often miss major moves if the specific breakout candle has low volume or weak ADX. This script utilizes a state-machine logic that "remembers" the trend direction. If a trend begins during low volatility (gray candles), the script waits. The moment volatility and momentum confirm the move, a Smart Recovery Signal is triggered, allowing you to enter an existing trend safely.
3. Chop Protection (Gray Candles)
Preservation of capital is the priority. The script analyzes the Average Directional Index (ADX) and Volatility (ATR).
Colored Candles (Green/Red): The market is trending with sufficient strength. Trading is permitted.
Gray Candles: The market is in a low-energy chop or consolidation (ADX < 20). Trading is discouraged.
4. Dynamic Trend Cloud
The space between the Fast and Slow trends is filled with a dynamic cloud.
Darker/Opaque Cloud: Indicates a widening spread, suggesting accelerating momentum.
Lighter/Transparent Cloud: Indicates a narrowing spread, suggesting the trend may be weakening or consolidating.
5. Pullback & Retest Signals (+)
While triangles mark the start of a trend, the Plus (+) signs mark low-risk opportunities to add to a position. These appear when price dips into the cloud, finds support at the "Fair Value" zone, and closes back in the direction of the trend with confirmed momentum.
User Guide & Strategy
Setup
Add the indicator to your chart.
For Beginners: Enable "Auto-Adaptive Timeframes" in the settings.
For Advanced Users: Disable Auto-Adapt and manually configure your Fast/Slow pairings (Default is Daily 50 EMA / Weekly 50 EMA).
Signal Mode: Choose "First Breakout Only" for a cleaner chart, or "All Signals" if you wish to see re-entry points during choppy starts.
Long Entry Criteria (Buy)
Trend: The Cloud must be Green (Fast Trend > Slow Trend).
Signal: A Green Triangle appears below the bar.
Confirmation: The signal candle must not be Gray.
Re-Entry: A small Green (+) sign appears, indicating a successful test of the cloud support.
Short Entry Criteria (Sell)
Trend: The Cloud must be Red (Fast Trend < Slow Trend).
Signal: A Red Triangle appears above the bar.
Confirmation: The signal candle must not be Gray.
Re-Entry: A small Red (+) sign appears, indicating a successful test of the cloud resistance.
Stop Loss & Risk Management
Stop Loss: A standard institutional stop loss is placed just beyond the Slow Trend Line (the outer edge of the cloud). If price closes beyond the Slow Trend, the macro thesis is invalid.
Take Profit: Target liquidity pools or use a trailing stop based on the Fast Trend line.
Settings Overview
Mode Selection: Toggle between Auto-Adaptive logic or Manual control.
Manual Configuration: Define the specific Timeframe, Length, and Type (EMA, SMA, WMA) for both Fast and Slow trends.
Signal Logic: Toggle "Show Pullback Signals" on/off. Switch between "First Breakout" or "All Signals."
Quality Filters: Toggle individual filters (ATR, RSI, ADX) to adjust sensitivity. Turning these off makes the script more responsive but increases false signals.
Visual Style: Customize colors for Bullish, Bearish, and Neutral (Gray) states. Adjust cloud transparency.
Disclaimer
Risk Warning: Trading financial markets involves a high degree of risk and is not suitable for all investors. You could lose some or all of your initial investment.
Educational Use Only: This script and the information provided herein are for educational and informational purposes only. They do not constitute financial advice, investment advice, trading advice, or any other recommendation.
No Guarantee: Past performance of any trading system or methodology is not necessarily indicative of future results. The "Institutional Trend" indicator is a tool to assist in technical analysis, not a crystal ball. The creators of this script assume no responsibility or liability for any trading losses or damages incurred as a result of using this tool. Always perform your own due diligence and consult with a qualified financial advisor before making investment decisions.
SMC Fib Range Signals [@gyanapravah]SMC Fib Range Signals
This indicator blends Smart Money Concepts (SMC) with a Range Filter Trend System and Fibonacci Retracement & Extensions to generate high-probability automated Buy/Sell signals.
Designed to avoid noise and focus on market structure + trend + price confluence, this tool is ideal for:
1. Intraday traders
2. Swing traders
3. Index & stock traders
4. Crypto & Forex traders
CORE FEATURES
Range Filter Trend Detection
Smooth adaptive filter identifies true trend direction
Visual confirmation:
🟢 Green filter = bullish pressure
🔴 Red filter = bearish pressure
🟡 Yellow filter = neutral
Upper & Lower Bands act as dynamic support/resistance zones
Smart Money Order Blocks (SMC)
Automatically detects important pivot highs & lows
Marks:
OB High → supply / resistance zone
OB Low → demand / support zone
Continuously tracks latest OB levels for live price interaction
Fibonacci Engine
Detects the current swing zone and plots:
Retracement levels
0.236 – 0.382 – 0.500 – 0.618 – 0.786 (editable)
Extension targets
1.272 – 1.618
All levels update dynamically on new market structure and pivots.
SIGNAL ENGINE
This indicator generates signals from three independent confirmation systems:
BUY SIGNALS trigger when:
1. Trend flips bullish (price crosses above the Filter)
2.Bullish trend + price reacts near:
Order Block support
Fibonacci 0.382 / 0.618 levels
Bounce from the Lower Band with trend support
All setups require volume confirmation to filter fake breakouts.
SELL SIGNALS trigger when:
1. Trend flips bearish (price crosses below the Filter)
2. Bearish trend + price reacts near:
Order Block resistance
Fibonacci 0.382 / 0.618 levels
Rejection from the Upper Band with trend support
ALERTS READY
Two built-in alerts:
BUY Alert — fires on bullish signal
SELL Alert — fires on bearish signal
INPUT SETTINGS
Trend Engine
1.Source
2.Sampling Period
3.Range Multiplier
Smart Money
Pivot detection sensitivity (Left / Right bars)
Fibonacci
1.Swing lookback length
2.Editable Fib retracement and extension values
3.Toggle show/hide Fib levels
BEST USE CASE
Works extremely well on:
⏱️ 3M – 15M Intraday scalping
⏱️ 30M – 1H positional entries
⏱️ 4H – D1 swing trading
Tested on:
NIFTY / BANKNIFTY / FINNIFTY
Stocks
Crypto
Forex
DISCLAIMER
This indicator is for educational purposes only.
It does NOT guarantee profits.
Always use:
Proper risk management
Stop-loss rules
Your own confirmation before entering trades.
AUTHOR
Built & shared by @gyanapravah (Odisha, India)
Open-source for learning and community improvement.
Smart Money Concepts by Rakesh Sharma🎯 SMART MONEY CONCEPTS - TRADE WITH INSTITUTIONS
Reveal where banks, hedge funds, and institutional traders enter the market. Trade alongside smart money, not against them!
✨ FEATURES:
- Order Blocks (OB) - Institutional buying/selling zones
- Fair Value Gaps (FVG) - Market inefficiencies to exploit
- Break of Structure (BOS) - Trend continuation signals
- Change of Character (ChoCh) - Early reversal detection
- Liquidity Sweeps - Stop hunt identification
- Premium/Discount Zones - Buy cheap, sell expensive
- Live Dashboard - Real-time market structure
🎯 HOW TO USE:
✓ BUY in Discount Zone at Bullish Order Blocks
✓ SELL in Premium Zone at Bearish Order Blocks
✓ Wait for ChoCh or BOS confirmation
✓ Follow institutional footprints for high-probability setups
📊 PERFECT FOR:
All markets - Nifty, Bank Nifty, Stocks, Forex, Crypto
All timeframes - 5m (scalping), 15m (intraday), Daily (swing)
⚡ TRADING EDGE:
Stop trading like retail. Start trading like institutions. See where smart money accumulates and distributes. Catch reversals early with ChoCh signals.
Created by: Rakesh Sharma | Version 1.0
Sniper 50: The Trend Master [Pure Signal]Overview Sometimes, the simplest strategies are the deadliest. This indicator brings the legendary "EMA 50 Strategy" to your chart in its purest form. It is designed to capture major market trends and reversals immediately as they happen, stripping away complex filters that often cause lag.
Why the EMA 50? The 50-period Exponential Moving Average is widely regarded by institutional traders as the primary divider between bullish and bearish territory. This tool automates the monitoring of this key level.
How It Works The logic is raw and direct:
BUY Signal: Triggered immediately when the candle closes ABOVE the EMA 50.
SELL Signal: Triggered immediately when the candle closes BELOW the EMA 50.
Key Features
Zero Noise Technology: Includes a built-in state machine that prevents repetitive signals. You will receive exactly ONE signal when the trend flips, and silence until the next reversal.
Dynamic Visuals: The EMA line changes color (Green for Bullish, Red for Bearish) to give you instant context.
Lag-Free: unlike other tools that wait for multiple confirmations, this tool prioritizes speed to catch sharp moves (like sudden crashes or rallies).
Best For
Trend Following
Swing Trading (Crypto & Stocks)
Catching rapid reversals that complex indicators might miss.
EMA Cloud TrendEMA Cloud Trend (Dual-Layer)
A clean and popular two-layer EMA cloud indicator:
• Inner cloud (EMA 8 – EMA 18): Bright yellow with 80% transparency
• Outer cloud (EMA 18 – EMA 36): Green (bullish) or Red (bearish) with 70% transparency
Trend direction is determined by the position of the fast EMA (8) relative to the slow EMA (36):
- Green outer cloud → Bullish bias
- Red outer cloud → Bearish bias
Fully transparent design that doesn’t hide price action. Perfect for trend confirmation, swing trading, and as a visual background filter.
Lightweight • No repainting • Works on all markets and timeframes
Enjoy the clouds!
EMA Cloud Trend (Çift Katmanlı)
Bassi MACD Pro + ADX Filter + Smart Histogram TP + RSIA professional-grade MACD indicator that dramatically reduces false signals by combining four powerful filters:
Key Features
Classic MACD (12,26,9) with clean, high-visibility histogram coloring
ADX + DI filter – only takes trades when ADX > user-defined threshold (default 25) ensuring you trade only in strong trending markets
Smart Histogram Take-Profit logic – automatically detects the exact moment bullish/bearish momentum starts to weaken after a strong move and marks a precise TP level (one TP per trade – no repainting, no multiple signals)
Zero-line crossover confirmation + histogram direction filter – eliminates many whipsaw signals common in regular MACD
Separate RSI pane with overbought/oversold levels and visual markers (for additional confluence – does not interfere with main logic)
Visual Signals
Green “MACD BUY” label + lime triangle = confirmed long entry in strong trend
Red “MACD SELL” label + red triangle = confirmed short entry in strong trend
Small lime/red “TP” triangles = Smart Histogram Take-Profit triggered (perfect exit timing based on momentum fade)
Alert Conditions Included
MACD BUY
MACD SELL
TP Long Hit
TP Short Hit
Combined “Any Signal” alert
Why this version outperforms standard MACD
Most MACD crossovers fail in ranging markets. This script solves that by:
Requiring strong trend (ADX filter)
Confirming histogram is actually growing in the new direction
Waiting for the true zero-line cross with momentum
Giving you an intelligent, non-fixed % take-profit based on real histogram exhaustion
Excellent for swing trading, day trading, crypto, forex, and stocks on any timeframe (works especially well on 1H–4H–Daily).
Clean, fast, no repainting, fully alert-ready.
Add to chart → set your alerts → trade only the highest-probability MACD signals.
⚔️ The Scalpel⚔️ THE SCALPEL v2.0
━━━━━━━━━━━━━━━━━━━━━━━━━━━━━━━━━━━━━━━━━━━━━━━━━━━━━━━━
Surgical-Grade Market Structure Detection System
🔬 WHAT IS THE SCALPEL?
The Scalpel is a precision-engineered market structure analyzer that identifies and tracks critical support and resistance zones with surgical accuracy. Unlike conventional S&R tools that flood your chart with noise, The Scalpel cuts through the clutter to reveal only the most significant price structures.
━━━━━━━━━━━━━━━━━━━━━━━━━━━━━━━━━━━━━━━━━━━━━━━━━━━━━━━━
⚙️ CORE TECHNOLOGY
▸ Pivot-Based Detection Engine
Advanced pivot analysis calibrated by user-defined precision settings
▸ Tissue Integrity Validation
Filters structures based on candle body-to-range ratios
▸ Dynamic Stress Analysis
Tracks zone interactions and removes exhausted levels automatically
▸ Volatility-Adaptive Zones
Zone width scales with ATR for consistent performance across all markets
━━━━━━━━━━━━━━━━━━━━━━━━━━━━━━━━━━━━━━━━━━━━━━━━━━━━━━━━
🎨 VISUAL SPECTRUM
💜 STERILE ZONES (Electric Violet)
Fresh, untested structures with maximum potential
🔴 COMPRESSION ZONES (Magenta Fire)
Tested resistance ceilings under selling pressure
🩵 FOUNDATION ZONES (Neon Teal)
Tested support floors with proven buyer interest
✨ PLASMA AURA EFFECT
Multi-layered glow effect for enhanced visibility
━━━━━━━━━━━━━━━━━━━━━━━━━━━━━━━━━━━━━━━━━━━━━━━━━━━━━━━━
📐 PARAMETERS
🔪 Blade Precision (1-10)
Higher = fewer but sharper pivots detected
🩺 Tissue Integrity % (30-90)
Minimum candle body percentage required
📏 Incision Depth (0.1-2.0 ATR)
Controls zone thickness based on volatility
💉 Stress Threshold (1-10)
Maximum touches before zone invalidation
📐 Projection Range (10-200)
How far zones extend into the future
━━━━━━━━━━━━━━━━━━━━━━━━━━━━━━━━━━━━━━━━━━━━━━━━━━━━━━━━
💡 HOW TO USE
1. Fresh sterile zones (violet) are your highest-probability setups
2. Watch for price reaction at zone boundaries
3. Tested zones confirm structure but may have diminished strength
4. Zones auto-remove after stress threshold is reached
5. Use projection range to anticipate future tests
━━━━━━━━━━━━━━━━━━━━━━━━━━━━━━━━━━━━━━━━━━━━━━━━━━━━━━━━
🎯 BEST FOR
✓ Scalping & Day Trading
✓ Swing Trade Entries
✓ Stop Loss Placement
✓ Take Profit Targeting
✓ Multi-Timeframe Analysis
━━━━━━━━━━━━━━━━━━━━━━━━━━━━━━━━━━━━━━━━━━━━━━━━━━━━━━━━
⚠️ DISCLAIMER
This indicator is for educational purposes only. Always conduct your own analysis and use proper risk management. Past performance does not guarantee future results.
━━━━━━━━━━━━━━━━━━━━━━━━━━━━━━━━━━━━━━━━━━━━━━━━━━━━━━━━
🏷️ TAGS
support resistance zones SNR pivot points market structure scalping day trading swing trading price action order blocks smart money supply demand technical analysis
EMA + Sessions + RSI Strategy v1.0A professional trading strategy that combines multiple technical indicators for high-probability entries. This system uses EMA crossovers, RSI zone filtering, and trend confirmation to identify optimal trading opportunities while managing risk with advanced position management tools.
Key Features:
✅ Dual Entry Signals (EMA21 + EMA100 crossover conditions)
✅ Trend Filter EMA750 (trade only with the major trend)
✅ Complete Risk Management (SL 1%, TP 3% default)
✅ Trailing Stop & Breakeven (maximize profits, protect capital)
✅ Compact Statistics Table (real-time performance metrics)
✅ RSI & Session Filters (avoid low-probability setups)
✅ Optional Pyramiding (scale into winning positions)
Perfect for swing trading and trend-following on any timeframe. Fully customizable to match your trading style.
Helix Protocol 7HELIX PROTOCOL 7
Overview
Helix Protocol 7 is an advanced trend-adaptive signal engine that dynamically adjusts its buy/sell thresholds based on real-time market regime detection. Unlike static indicators that use fixed overbought/oversold levels, Helix 7 recognizes that optimal entry and exit points shift dramatically depending on whether the market is trending strongly, ranging, or reversing.
The indicator fuses multiple analytical frameworks—momentum oscillators, trend strength metrics, volatility analysis, volume confirmation, and price structure—into a unified signal system that adapts to changing market conditions in real-time.
Core Philosophy
"Don't fight the trend—adapt to it."
In a strong uptrend, you want to buy dips early (before extreme oversold) and let winners run longer
In a downtrend, you want to sell bounces quickly and only buy true capitulation
In a neutral/ranging market, standard overbought/oversold levels apply
Helix Protocol 7 automatically detects which regime you're in and applies the appropriate thresholds.
Key Features
🔄 Trend-Adaptive Signal Thresholds
The indicator classifies markets into four states and adjusts Fisher Transform and RSI thresholds accordingly:
Trend StateDetection CriteriaBUY TriggersSELL TriggersSTRONG UPTRENDADX rising, ADX > 25, +DI > -DIFisher < 1.0, RSI < 50Fisher > 2.5, RSI > 70STRONG DOWNTRENDADX rising, ADX > 25, -DI > +DIFisher < -2.5, RSI < 25Fisher > 1.5, RSI > 60WEAK DOWNTRENDADX falling, -DI > +DIFisher < -2.5, RSI < 25Fisher > 1.5, RSI > 60NEUTRALDefault fallbackFisher < -2.0, RSI < 30Fisher > 2.0, RSI > 65
📊 Dynamic Envelope Bands
Adaptive bands that expand and contract based on:
ATR (Average True Range) - Base volatility measure
ADX (Trend Strength) - Bands widen in strong trends
Chaikin Oscillator - Volume-weighted band adjustment
🎯 Multi-Trigger Signal System
Signals can fire from multiple sources:
Trend-Based Signals - Fisher + RSI thresholds met for current regime
Band Touch Signals - Price touches upper/lower band (support/resistance)
EXTREME Signals - Price penetrates band by significant amount (bypasses cooldown)
⚡ Extreme Move Detection
When price makes an explosive move that penetrates the band by more than 30% of ATR (configurable), the signal fires with EXTREME priority and bypasses the normal cooldown period. This ensures you never miss major reversal opportunities.
📈 GXS Scoring System
A proprietary multi-factor scoring system (-1.0 to +1.0) that weighs:
Trend Strength (30%) - ADX direction and magnitude
Momentum (25%) - RSI, MACD, Stochastic, CCI, ROC consensus
Volume (20%) - OBV trend and volume surge detection
Price Structure (15%) - Band position and volatility percentile
Price Action (10%) - Bullish/bearish candle ratio
🔀 RSI Divergence Detection
Automatically detects and displays:
Regular Bullish Divergence - Price lower low + RSI higher low (reversal up)
Regular Bearish Divergence - Price higher high + RSI lower high (reversal down)
Hidden Bullish Divergence - Trend continuation signal (uptrend)
Hidden Bearish Divergence - Trend continuation signal (downtrend)
📉 BBWP Volatility Meter
Bollinger Band Width Percentile measures current volatility relative to historical norms:
LOW (< 30%) - Volatility compression, breakout imminent
MEDIUM (30-70%) - Normal market conditions
HIGH (> 70%) - Extended volatility, potential exhaustion
Visual Components
Money Line
A dynamic centerline (Linear Regression or Weighted EMA) colored by slope:
🟢 Green - Rising (bullish momentum)
🔴 Red - Falling (bearish momentum)
🟡 Yellow - Flat (consolidation)
Envelope Cloud
Shaded region between upper and lower bands, colored by Money Line slope direction for instant trend visualization.
Signal Labels
Clear entry/exit labels showing:
Price level
Trigger type (UPTREND DIP, CAPITULATION, BAND TOUCH, EXTREME, etc.)
Color coding (Green=Buy, Red=Sell, Lime=Extreme Buy, Fuchsia=Extreme Sell)
ADX Trend Bar
Bottom indicator showing trend state:
🟢 Lime - Strong Uptrend
🔴 Red - Downtrend
🟠 Orange - Weak/Transitional (ADX 15-24)
⚪ White - Ranging (ADX < 15)
🔵 Blue - Strong trend, neutral direction
Info Panel
Real-time dashboard displaying:
Current trend state
GXS Score
Active divergences
Volatility level (BBWP)
ADX value and direction
DI Spread
Fisher Transform value
RSI value
Context-sensitive BUY/SELL thresholds for current regime
Alert System
JSON Webhook Alerts (Bot-Ready)
json{
"action": "BUY",
"symbol": "BTC/USDT",
"price": "93500.00",
"trigger": "EXTREME",
"rsi": "28.5",
"fisher": "-2.31",
"adx": "32.4",
"trend_state": "STRONG DOWN"
}
Available Alert Conditions
Buy Signal / Sell Signal
Lower Band Touch / Upper Band Touch
EXTREME Lower Band / EXTREME Upper Band
Strong Uptrend Started
Downtrend Started
Neutral Trend Started
Trend State Change
Recommended Settings
Scalping (1m-5m)
Signal Cooldown: 3-5 bars
Extreme Penetration: 0.2 (more sensitive)
ADX Length: 10-12
Swing Trading (15m-4H)
Signal Cooldown: 5-8 bars
Extreme Penetration: 0.3 (default)
ADX Length: 14 (default)
Position Trading (Daily+)
Signal Cooldown: 8-12 bars
Extreme Penetration: 0.4-0.5 (less sensitive)
ADX Length: 14-20
Input Parameters
Core Settings
Money Line Type (Linear Regression / Weighted EMA)
Money Line Length
RSI Period
Fisher Period
Dynamic Bands
ATR Period & Multiplier
Adaptive Bands toggle
Chaikin Weight
Extreme Band Penetration threshold
Trend Detection
ADX Length & Slope Lookback
Strong Trend ADX Threshold
DI Spread for Neutral detection
Signal Thresholds (by Trend State)
Fully customizable Fisher/RSI/ADX levels for each regime
Separate BUY and SELL parameters
Display Options
Toggle bands, cloud, labels, panels
Cooldown period
Debug panel for troubleshooting
Best Practices
Confirm with price action - Signals are high-probability setups, not guarantees
Respect the trend state - The panel shows current thresholds for a reason
Watch for EXTREME signals - These indicate significant reversals
Use divergences as confluence - Especially powerful at band touches
Monitor volatility - Low BBWP often precedes big moves
Version: 7.0
Author: ralis24
IDWM Master StructureExecutive Summary
The IDWM Master Structure is a Multi-Timeframe (MTF) trading tool designed to force discipline by aligning traders with the "Parent" trend. It functions by locking onto the "Completed Auction" of a higher timeframe candle (like a Daily or Weekly bar) and projecting that structure onto your lower timeframe chart. Its primary goal is to define the "Dealing Range"—the hard boundaries where value was previously established—so you don't get lost in the noise of smaller price movements.
1. The Principle of Completed Auctions (Hierarchy)
Most technical indicators curve dynamically with every price tick. This script acts differently because it relies on "Settled Arguments." A closed Daily candle represents a finished battle between buyers and sellers; the High and Low are the historical results of that battle.
To enforce this, the script automatically selects a "Parent" timeframe based on your view:
Scalping (charts below 15 minutes) uses the 4-Hour Auction.
Intraday trading (15 minutes to 4 Hours) uses the Daily Auction.
Swing trading (Daily chart) uses the Weekly Auction.
2. Liquidity Pools & The Sticky Range
The High and Low lines drawn by the indicator are not just support and resistance; they represent Liquidity Pools. In market theory, stop-losses (Sell Stops below Lows, Buy Stops above Highs) accumulate at these edges.
Smart money often pushes price just past these lines to grab this liquidity (a "Stop Hunt") before reversing direction. To account for this, the script uses a "Sticky Range" mechanism. It refuses to redraw the box simply because price touched the line. Instead, it uses an Average True Range (ATR) Buffer. A new structure is only formed if the candle closes decisively outside the range plus this volatility buffer. This ensures you are trading real breakouts, not liquidity sweeps.
3. Internal Range Mechanics (Premium vs. Discount)
Inside the Master Box, the script applies Equilibrium Theory to help with trade location.
The most important internal line is the Equilibrium (EQ), which marks the exact 50% point of the range.
Premium Zone (Above EQ): Price is mathematically "expensive" relative to the recent range. Algorithms generally look to establish Short positions here.
Discount Zone (Below EQ): Price is considered "cheap." Algorithms generally look to establish Long positions here.
It also plots the Master Open, which acts as a "Line in the Sand." If price is currently trading above the Master Open, the higher timeframe candle is Green (Bullish), suggesting longs have a higher probability. If below, the candle is Red (Bearish).
4. Wick Theory (Failed Auctions)
The script places special emphasis on the wicks of the Master Candle because a wick represents a "Failed Auction"—a price level the market tried to explore but ultimately rejected.
The indicator highlights the background of the wick area (from the High to the Body). On a retest, these zones often act as supply or demand blocks because the market remembers the previous failure.
It also calculates the "Consequent Encroachment," which is the 50% midpoint of the wick. The rule of thumb here is that if a candle body can close past 50% of a wick, the rejection is nullified, and price will likely travel to fill the entire wick.
5. Energy Expansion (Breakout Targets)
Market energy transfers from Consolidation (inside the box) to Expansion (the breakout). When the price finally breaks the "Sticky Range" (confirming via the ATR buffer), the script projects where that energy will go.
It uses the height of the previous range to calculate Fibonacci extensions. Specifically, it targets the 1.618 Extension, often called the "Golden Ratio." This is a statistically significant level where expansion moves tend to exhaust themselves and reverse.
6. Safety Protocol: Live Detection
A dashboard monitors the state of the parent candle. If the text turns Magenta with a warning symbol, it means the Higher Timeframe candle is "Live" (still forming).
Trading off a live structure is considered higher risk because the "Auction" isn't finished—the High or Low can still shift. The safest approach is to trade when the dashboard indicates a standard, locked, historical structure.
STRAT - MTF Dashboard + FTFC + Reversals v2.7# STRAT Indicator - Complete Description
## Overview
A comprehensive multi-timeframe STRAT trading system indicator that combines market structure analysis, flip levels, Full Timeframe Continuity (FTFC), and reversal pattern detection across 12 timeframes.
## Core Features
### 1. **Multi-Timeframe STRAT Dashboard**
- Displays STRAT combos (1, 2u, 2d, 3) across 12 timeframes: 1m, 5m, 15m, 30m, 1H, 4H, 12H, Daily, Weekly, Monthly, Quarterly, Yearly
- Color-coded directional bias (green/red/doji)
- Inside bars (●) and Outside bars (●) highlighted
- Current timeframe marked with ★
### 2. **HTF Flip Levels with Smart Grouping**
- Displays higher timeframe (HTF) flip levels (open prices) as labels on the right side
- Automatically groups multiple timeframes at the same price level (e.g., "★ 1H/4H/D")
- Current timeframe flip level always displayed with ★ marker
- Color-coded: Green (above price) / Red (below price)
### 3. **Full Timeframe Continuity (FTFC)**
- User-selectable 4 timeframes for FTFC analysis (default: D, W, M, Q)
- Green line: FTFC Up (highest open of 4 timeframes)
- Red line: FTFC Down (lowest open of 4 timeframes)
- Identifies when price is above/below all 4 timeframe opens
### 4. **Hammer & Shooting Star Detection**
- **Hammer Pattern**: Long lower wick (≥2x body), small upper wick, signals potential bottom reversal
- **Shooting Star Pattern**: Long upper wick (≥2x body), small lower wick, signals potential top reversal
- Scans last 100 bars (adjustable) and marks ALL historical patterns
- Chart markers: 🔨 (Hammer) below bars, 🔻 (Shooting Star) above bars
- Dashboard column shows reversal patterns for each timeframe
- Adjustable wick-to-body ratio sensitivity (1.5 to 5.0)
### 5. **Debug Tables**
- **FTFC Debug**: Shows close vs. 4 timeframe opens, confirms all-green/all-red conditions
- **Reversal Debug**: Real-time analysis of current bar - body size, wick measurements, ratios, and pattern qualification
## Settings
### Display Settings
- Dashboard position (9 options: top-left to bottom-right)
- Dashboard text size (tiny to huge)
- Label offset and text size
- Toggle individual features on/off
### FTFC Settings
- Select 4 custom timeframes for continuity analysis
- Default: Daily, Weekly, Monthly, Quarterly
### Reversal Settings
- **Wick to Body Ratio**: Sensitivity for pattern detection (default 2.0)
- **Lookback Bars**: How many historical bars to scan (default 100, max 500)
- Show/hide reversal markers on chart
- Show/hide reversal debug table
## Use Cases
1. **Momentum Trading**: Identify STRAT setups (2-2, 2-1-2 reversals, 3-bar plays) across multiple timeframes
2. **Swing Trading**: Use HTF flip levels as support/resistance and FTFC for trend confirmation
3. **Reversal Trading**: Catch hammer/shooting star patterns at key levels for counter-trend entries
4. **Multi-Timeframe Analysis**: Confirm alignment across timeframes before entering trades
## How to Use
### For STRAT Traders
- Look for 2-1-2 reversal setups in the dashboard
- Watch for inside bars (●) at HTF flip levels for breakout trades
- Use outside bars (●) to identify potential volatility expansion
### For Reversal Traders
- 🔨 Hammers after downtrends = potential long entries
- 🔻 Shooting stars after uptrends = potential short entries
- Combine with HTF flip levels for high-probability setups
### For Trend Followers
- FTFC green line above = bullish structure
- FTFC red line below = bearish structure
- Enter when price breaks and holds above/below FTFC levels
## Visual Elements
- **Green Labels**: HTF flip levels above current price (resistance)
- **Red Labels**: HTF flip levels below current price (support)
- **Lime Line**: FTFC Up (highest timeframe open)
- **Red Line**: FTFC Down (lowest timeframe open)
- **🔨 Icon**: Hammer pattern (potential reversal up)
- **🔻 Icon**: Shooting Star pattern (potential reversal down)
- **★ Symbol**: Current timeframe or multiple timeframes grouped
## Performance Notes
This indicator performs 12 multi-timeframe security calls and may take 15-30 seconds to calculate on initial load. This is normal for comprehensive MTF analysis.
## Version
v2.7 - Simplified reversal detection, current TF labeling, optimized performance
---
**Perfect for**: STRAT traders, multi-timeframe analysts, reversal pattern traders, swing traders looking for high-probability setups with confluence across timeframes.
ROC Bot AlertsA rules-based momentum scalping framework for short-term index futures
This indicator is designed for traders who focus on fast-moving, intraday momentum opportunities—particularly on lower timeframes such as the 1-minute chart. It uses a structured combination of trend filters and short-term momentum tools to help identify potential continuation entries during active market conditions.
Core Concept
The tool evaluates price behavior relative to a dynamic trend line while measuring short-term rate-of-change and directional strength. When all components align, the indicator highlights moments where the market may be transitioning into or sustaining momentum in one direction. Conversely, when conditions deteriorate or momentum weakens, the indicator suppresses signals to reduce noise and avoid choppy environments.
This approach aims to provide buy/sell signals for scalping in trending or expanding-volatility conditions.
What the Indicator Uses
The system assesses several factors before confirming a potential momentum signal:
A dynamic trend filter to determine directional bias
A rate-of-change threshold to confirm short-term acceleration
A trend-strength component to avoid signals during low-energy or ranging conditions
A cooldown mechanism to prevent rapid, back-to-back signals in unsettled areas
Only when all conditions align does the indicator paint a long or short trigger on the chart.
Intended Use
This tool is best suited for:
- Active scalpers
- Intraday index futures traders (NQ, ES, GC, etc.)
- Short-duration momentum traders
- Traders who prefer clean, rules-based decision making
It is not designed for swing trading, long-term trend following, or counter-trend strategies.
How to Read the Signals
- Buy markers appear when trend, momentum, and strength all support upward continuation.
- Sell markers appear when these same factors align in the opposite direction.
- The 90-period trend line can be shown or hidden based on user preference, but it remains part of the decision framework internally.
- The user may optionally adjust the momentum threshold (ROC%) to suit different volatility environments.
Important Notes
Signals are generated only on completed bars.
As with all technical tools, this should be used alongside proper risk and trade management practices.


